An interactive look at anisotropic descent
A hand-coded TypeScript figure: gradient descent on a stretched quadratic bowl, with a live learning-rate control. Plus the deploy recording for this very site.
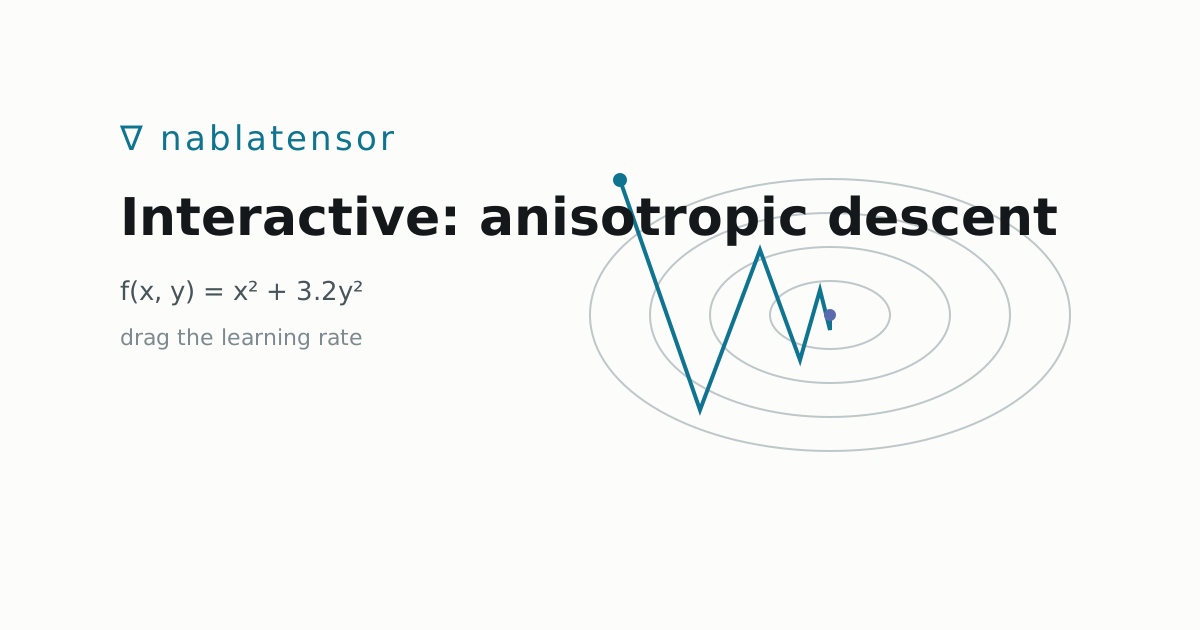
Calibration routines inside a pricing library are usually just optimisation: minimise the gap between model and market. When the objective is badly scaled — some parameters move the loss far more than others — a single global step size is a poor compromise. Too small and one direction crawls; too large and another oscillates.
The figure below runs plain gradient descent on f(x, y) = x² + 3.2y². The
y direction is 3.2× steeper. Drag the learning rate and watch where the
trade-off breaks.
The whole figure is one 'use client' React component — SVG, a
requestAnimationFrame loop, no chart library — hydrated as an island only when
the article loads. The rest of the page is static HTML.
Why this matters for the tape
The reverse sweep gives us the exact gradient of the calibration loss with respect to every model parameter at the cost of one extra pass. That makes second-order-aware methods (per-parameter scaling, L-BFGS) cheap enough to use by default instead of finite-difference Jacobians.
Deploying this site
The site you are reading is a small Next.js container. A content-only change — publishing this article, say — rebuilds into an image whose earlier layers are byte-identical to the last one, so the cluster only pulls the new article:
Details on that layering are in the repository's README.